In today’s fast-changing work environments, keeping employees safe is a top priority. There are many ways to improve safety, but the Safety Pyramid is a clear and practical framework that stands out. This concept not only categorizes different types of incidents based on their severity and frequency but also offers a strategic roadmap for organizations aiming to minimize risks and protect their workforce.
By focusing on the foundational elements at the bottom of the pyramid and understanding the intricate relationship between leading and lagging indicators, companies can initiate a culture change towards safety that not only prevents serious injuries and fatalities but fosters a proactive safety mindset among employees.

The Safety Pyramid is a framework used to help improve workplace safety by organizing incidents based on how often they happen and how serious they are.
- Unsafe behaviors and hazards at the bottom of the pyramid are common but less severe. If not fixed, they can lead to more serious incidents.
- As you move up the pyramid, the next level includes of near-misses, situations where an incident could have occurred but didn’t, followed by medical-only incidents that require treatment but do not result in time off work.
- Lost-time injuries, where employees have to take time off to recover, are next, indicating a more serious incident.
- Finally, at the top of the pyramid are the most severe but least frequent incidents, serious injuries, and fatalities.
The Safety Pyramid illustrates the idea that by focusing on and reducing the frequency of incidents at the base, organizations can ultimately decrease the occurrence of more severe incidents at the top.
At the bottom of the safety pyramid, you will find your leading indicators.
At the top of the pyramid, you have your lagging indicators.
And the very top of the pyramid is your most severe.
- So for every one serious injury or fatality, there are likely ten lost-time injuries.
- And for ten lost time injuries, there are a hundred medical-only incidents.
- And for every hundred of those, there are a thousand near-misses.
- And for every thousand near-misses, there are ten thousand unsafe behaviors and hazards.
Focus on the Bottom of the Safety Pyramid for Long Term Success
By tracking the leading indicators located at the bottom of the safety pyramid, we can achieve positive results that impact the top of the pyramid. Understanding our near misses, unsafe behaviors, and hazards is important, as they help us mitigate risks at the top of the safety pyramid. Taking proactive measures to enforce change is our core objective, as it leads to the elimination of serious injuries, fatalities, and lost-time incidents.

Deprecated: preg_match_all(): Passing null to parameter #2 ($subject) of type string is deprecated in /nas/content/live/kpaioprod/wp-content/plugins/one-user-avatar/includes/class-wp-user-avatar-functions.php on line 1025
Deprecated: preg_split(): Passing null to parameter #2 ($subject) of type string is deprecated in /nas/content/live/kpaioprod/wp-includes/formatting.php on line 3479
Examples of Bottom of the Safety Pyramid Metrics to Track
Organizations can prevent accidents by focusing on the bottom of the Safety Pyramid. This involves addressing unsafe behaviors and hazards early on. By doing so, the chance of serious incidents happening at the top is reduced.
Here’s how one KPA client did it.
The organization went on a culture change journey in 2013 and realized they were only measuring lagging indicators.
They started measuring leading indicators such as near-miss reporting and safety meetings to impact their lagging indicators positively.
The organization involved the whole team in reporting near misses, and this had a positive impact on lagging indicators.
They found that focusing on leading indicators helped improve their lagging indicators.
The organization realized the importance of both leading and lagging indicators, and they need to work together. The chart from 2019 shows the correlation between capturing leading indicators and the reduction of lagging indicators.

How to Get Started Using the Safety Pyramid to Measure What Matters.
How can a company get started if they are not doing anything today or if there are no specific measurements besides regulatory reporting? Here are four steps to get you off on the right foot.
Step 3. Engage Your Front-Line Workers
One of the major issues new KPA customers face is that employees do not trust their reporting system and feel their concerns aren’t being addressed.
Employees were hesitant to report incidents on paper, as they often didn’t reach the appropriate departments or supervisors.
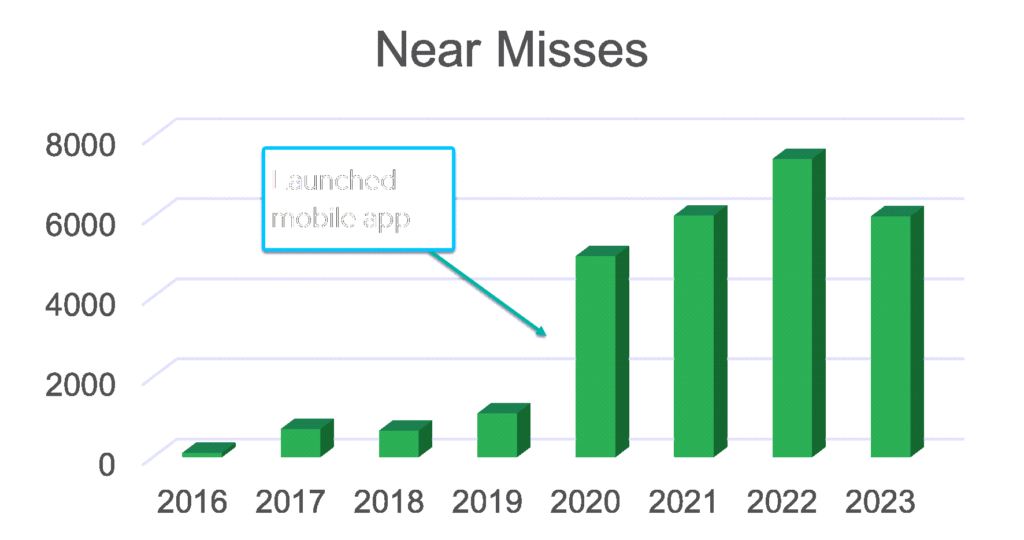
New customers often come to KPA because they need a digital tool that can help employees report incidents quickly and easily. That’s where KPA Flex’s mobile app comes in and allows employees to report incidents instantly, no matter where they are.
After introducing the mobile app, one KPA client’s reporting numbers skyrocketed from 23 to over 6,000. This was a clear indication that employees preferred the convenience of using their phones to report incidents.
Monitoring Safety Program KPIs is easier with solid EHS software in your team’s hands.
KPA simplifies data visualization and reporting, giving users easy access to actionable insights into their EHS program performance. Your data is presented in real-time, so no delay or extra steps are required to access the information. The dashboards are configured based on features tailored to your business’s unique requirements, giving you the power to make informed decisions that impact workplace safety.
Let KPA show you how to take a data-driven approach to safety.
Related Content
Explore more comprehensive articles, specialized guides, and insightful interviews selected, offering fresh insights, data-driven analysis, and expert perspectives.