When you walk into the boardroom with your safety budget request, what story does your data tell? If you’re leading with last year’s incident count and this year’s compliance checklist, you’re already speaking the wrong language.
The uncomfortable truth most safety leaders face: executives see safety as a compliance expense, not a strategic investment. But that perception isn’t their failure to understand your value—it’s our failure to communicate it in terms they care about.

The Executive Challenge: Breaking Through the Compliance Ceiling
Safety professionals struggle with a fundamental disconnect. You know the value of what you do—you see the near misses prevented, the hazards corrected before they become incidents, the culture shift happening on the floor. But when you present to leadership, those stories get lost in spreadsheets of lagging indicators that only document what’s already happened.
Most companies face a data fragmentation problem. Safety information lives in scattered Google Docs, aging spreadsheets, and paper files that make it nearly impossible to demonstrate real-time value. By the time you compile your quarterly report, the moment to influence decisions has passed.
Tony Conte, EHS Manager at J. Mullen & Sons, knows this challenge well. With experience spanning Ground Zero recovery, Amazon, IBM, and multiple high-risk industries, he’s seen how traditional safety reporting fails to capture executive attention. His approach changed when he shifted from reactive reporting to predictive data that tells a forward-looking story.
The Power of Predictive Data: Why Good Catches Matter More Than Incident Rates
Here’s what changes everything: executives prefer predictive data that prevents problems over reactive reports that document failures.
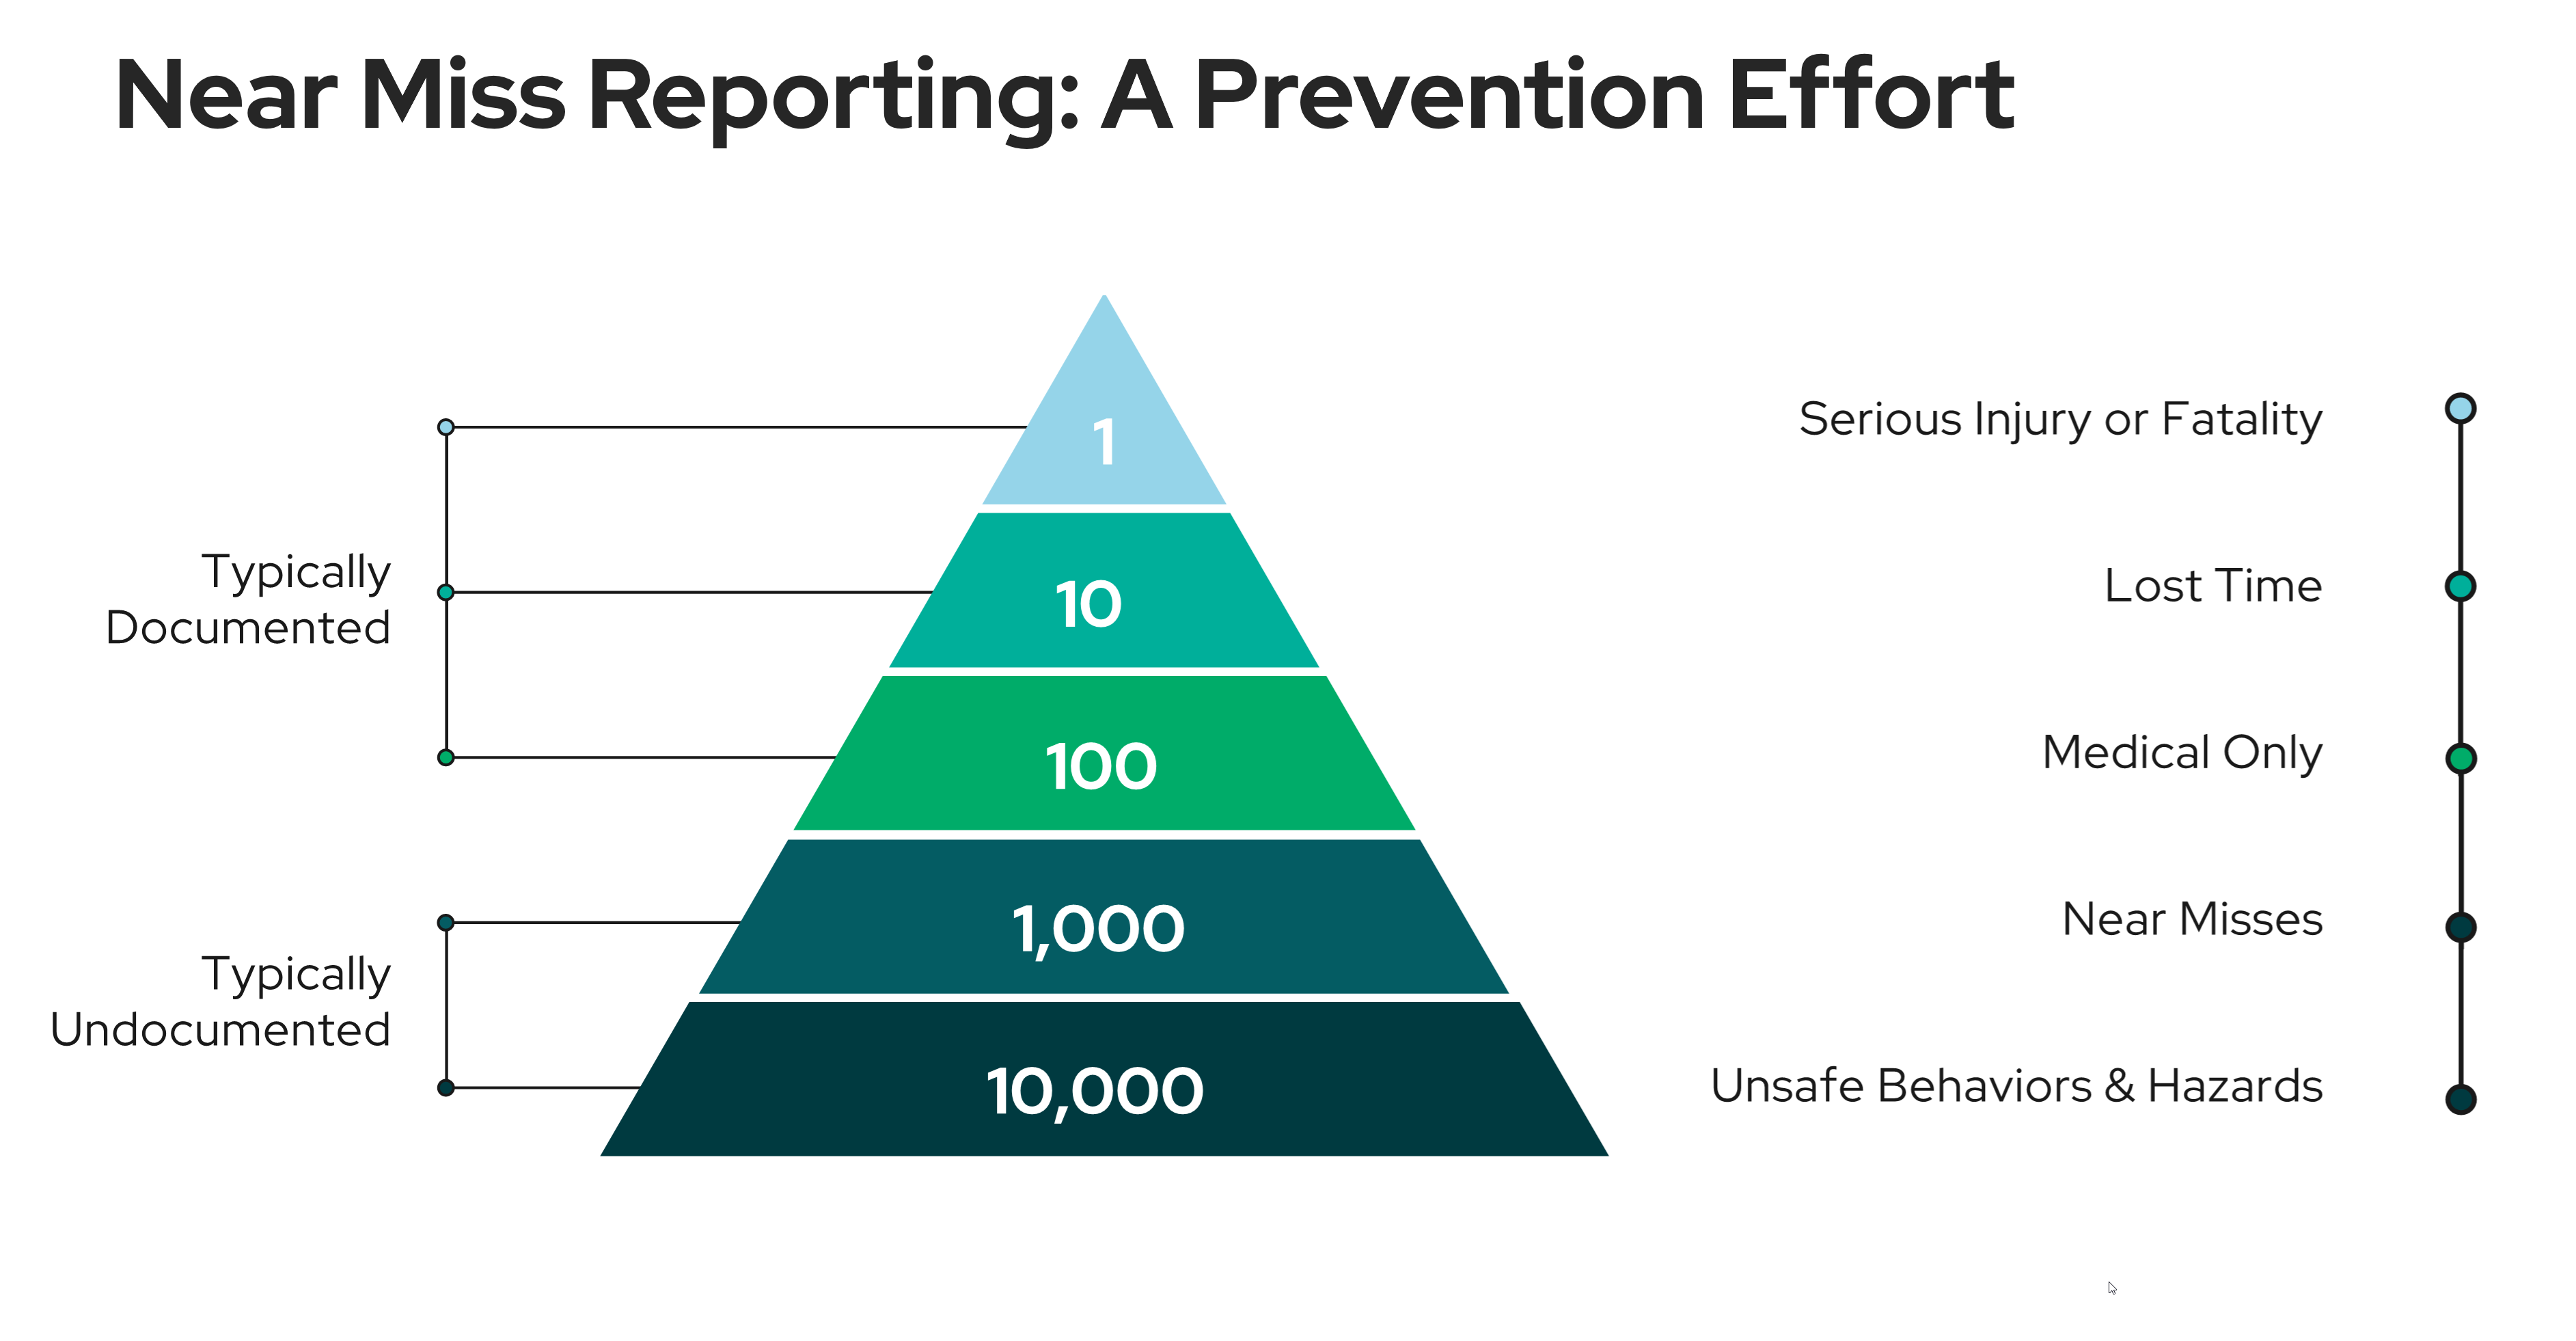
Heinrich’s Triangle has been around since the 1950s, but most safety leaders still aren’t leveraging its predictive power. The principle is straightforward: for every fatality, there are roughly 10 serious injuries, 30 minor injuries, 300 near misses, and 3,000 unsafe acts. The magic happens when you flip the triangle upside down in your thinking.
As Tony explains it:
If I’m going to look at the fatalities and lost time injuries, that’s way above the pyramid. But if I go after the near misses and unsafe acts, I don’t have to worry about the lost time injuries. Since I started two years ago, we haven’t had a recordable injury at all.
– Tony Conte, EHS Manager, J. Mullen & Sons | Watch the interview

Hear From Your Peers - Real ROI Stories
Securing buy-in for digital safety management can be challenging. Join Tony Conte, EHS Manager at J. Mullen & Sons, as he shares his real-world experience implementing KPA Flex at two different organizations.
Good catches and near misses aren’t just safety metrics—they’re proactive business intelligence that demonstrates your program is working before incidents occur. They show executives you’re identifying and eliminating risks in real-time, not just documenting problems after they’ve cost the company money.
Creating Your Success Metrics Dashboard: What Executives Actually Want to See
The right metrics tell a story of prevention, efficiency, and business value. Here’s how to build a dashboard that gets executive attention and keeps safety top-of-mind:
Keeping Safety Visible Without Overwhelming Leadership
Executives need to see safety data regularly, but they don’t need to see everything all the time. Here’s a reporting rhythm that maintains visibility without creating inbox fatigue:
Weekly Updates
- Near misses and good catches: Brief summary of what the team identified and corrected
- Open incidents: Status of any active investigations
- Overdue actions: What needs leadership attention
Monthly Reviews
- Trend analysis: Are near misses increasing (good) or are incident patterns emerging (requires action)?
- Training completion: Which departments are on track, which need focus
- Leading indicator progress: How many potential incidents did we prevent?
Quarterly Business Reviews
- Cost avoidance calculations: The dollar value of prevented incidents
- Year-over-year comparisons: Clear before/after story
- ROI update: How the safety program investment is paying off
Annual Strategic Planning
- E-mod impact: How safety performance affects insurance rates
- Industry recognition: Awards, audit results, client feedback
- Program evolution: Where to invest next year
- Near misses and good catches
- Open incidents status
- Overdue actions
- Trend analysis
- Training completion by department
- Leading indicator progress
- Cost avoidance calculations
- Year-over-year comparisons
- ROI updates
- E-mod impact on insurance rates
- Industry recognition & audit results
- Program evolution & investment
Third-Party Validation: Let Others Make Your Case
Sometimes the most powerful voice in your safety budget presentation isn’t yours—it’s the independent validation from regulators, insurers, and clients who’ve seen your program in action.
When OSHA, insurance auditors, or the Department of Labor review your program and find nothing to criticize—or better yet, commend you for exceeding requirements—that feedback becomes part of your executive communication. Tony experienced this firsthand when a DOL inspector told him, “You’re well beyond what they’re looking for.”
That kind of validation does two things: it proves your program works to external standards, and it demonstrates that your investment in systems and processes creates measurable regulatory confidence. Both matter to risk-averse executives.
Insurance auditors who leave with zero recommendations signal to your CFO that you’re minimizing the company’s liability exposure. Companies achieving top-ten recognition in their captive insurance groups aren’t just saving money—they’re gaining competitive positioning that can influence contract awards and partnership opportunities.
Your Next Step: Audit Your Current Data Story
Take 15 minutes this week to answer one question: Is your safety data telling a predictive or reactive story?
Pull up your most recent safety presentation to leadership. Count how many metrics are lagging indicators (incidents that already happened) versus leading indicators (risks you identified and eliminated). If the ratio is heavily weighted toward lagging indicators, you have an opportunity.
Start tracking good catches and near misses with the same rigor you track recordable incidents. Make them visible in your weekly updates. Calculate the cost avoidance they represent. Show executives you’re preventing problems, not just documenting them.
The language of the C-suite isn’t OSHA regulations and compliance checklists—it’s risk mitigation, cost avoidance, and competitive advantage. When your safety data speaks that language, budget conversations change from defensive justifications to strategic investments.
Your incidents tell the story of what went wrong. Your leading indicators tell the story of what went right. Which story do you want executives to remember when budget decisions get made?
Related Content
Explore more comprehensive articles, specialized guides, and insightful interviews selected, offering fresh insights, data-driven analysis, and expert perspectives.