Data is the best tool you have to reduce workplace risk. Let’s take a look at an important type of safety data – called Leading Indicators, or Predictive Analytics to improve safety at your workplace.
The word to grasp on to in what we’ve mentioned so far is “predictive.” Use your safety data as a crystal ball – helping you predict the future. Keeping an eye on these leading indicators can prevent serious accidents and incidents before they happen.
Types of Safety Data, and How to Use Them
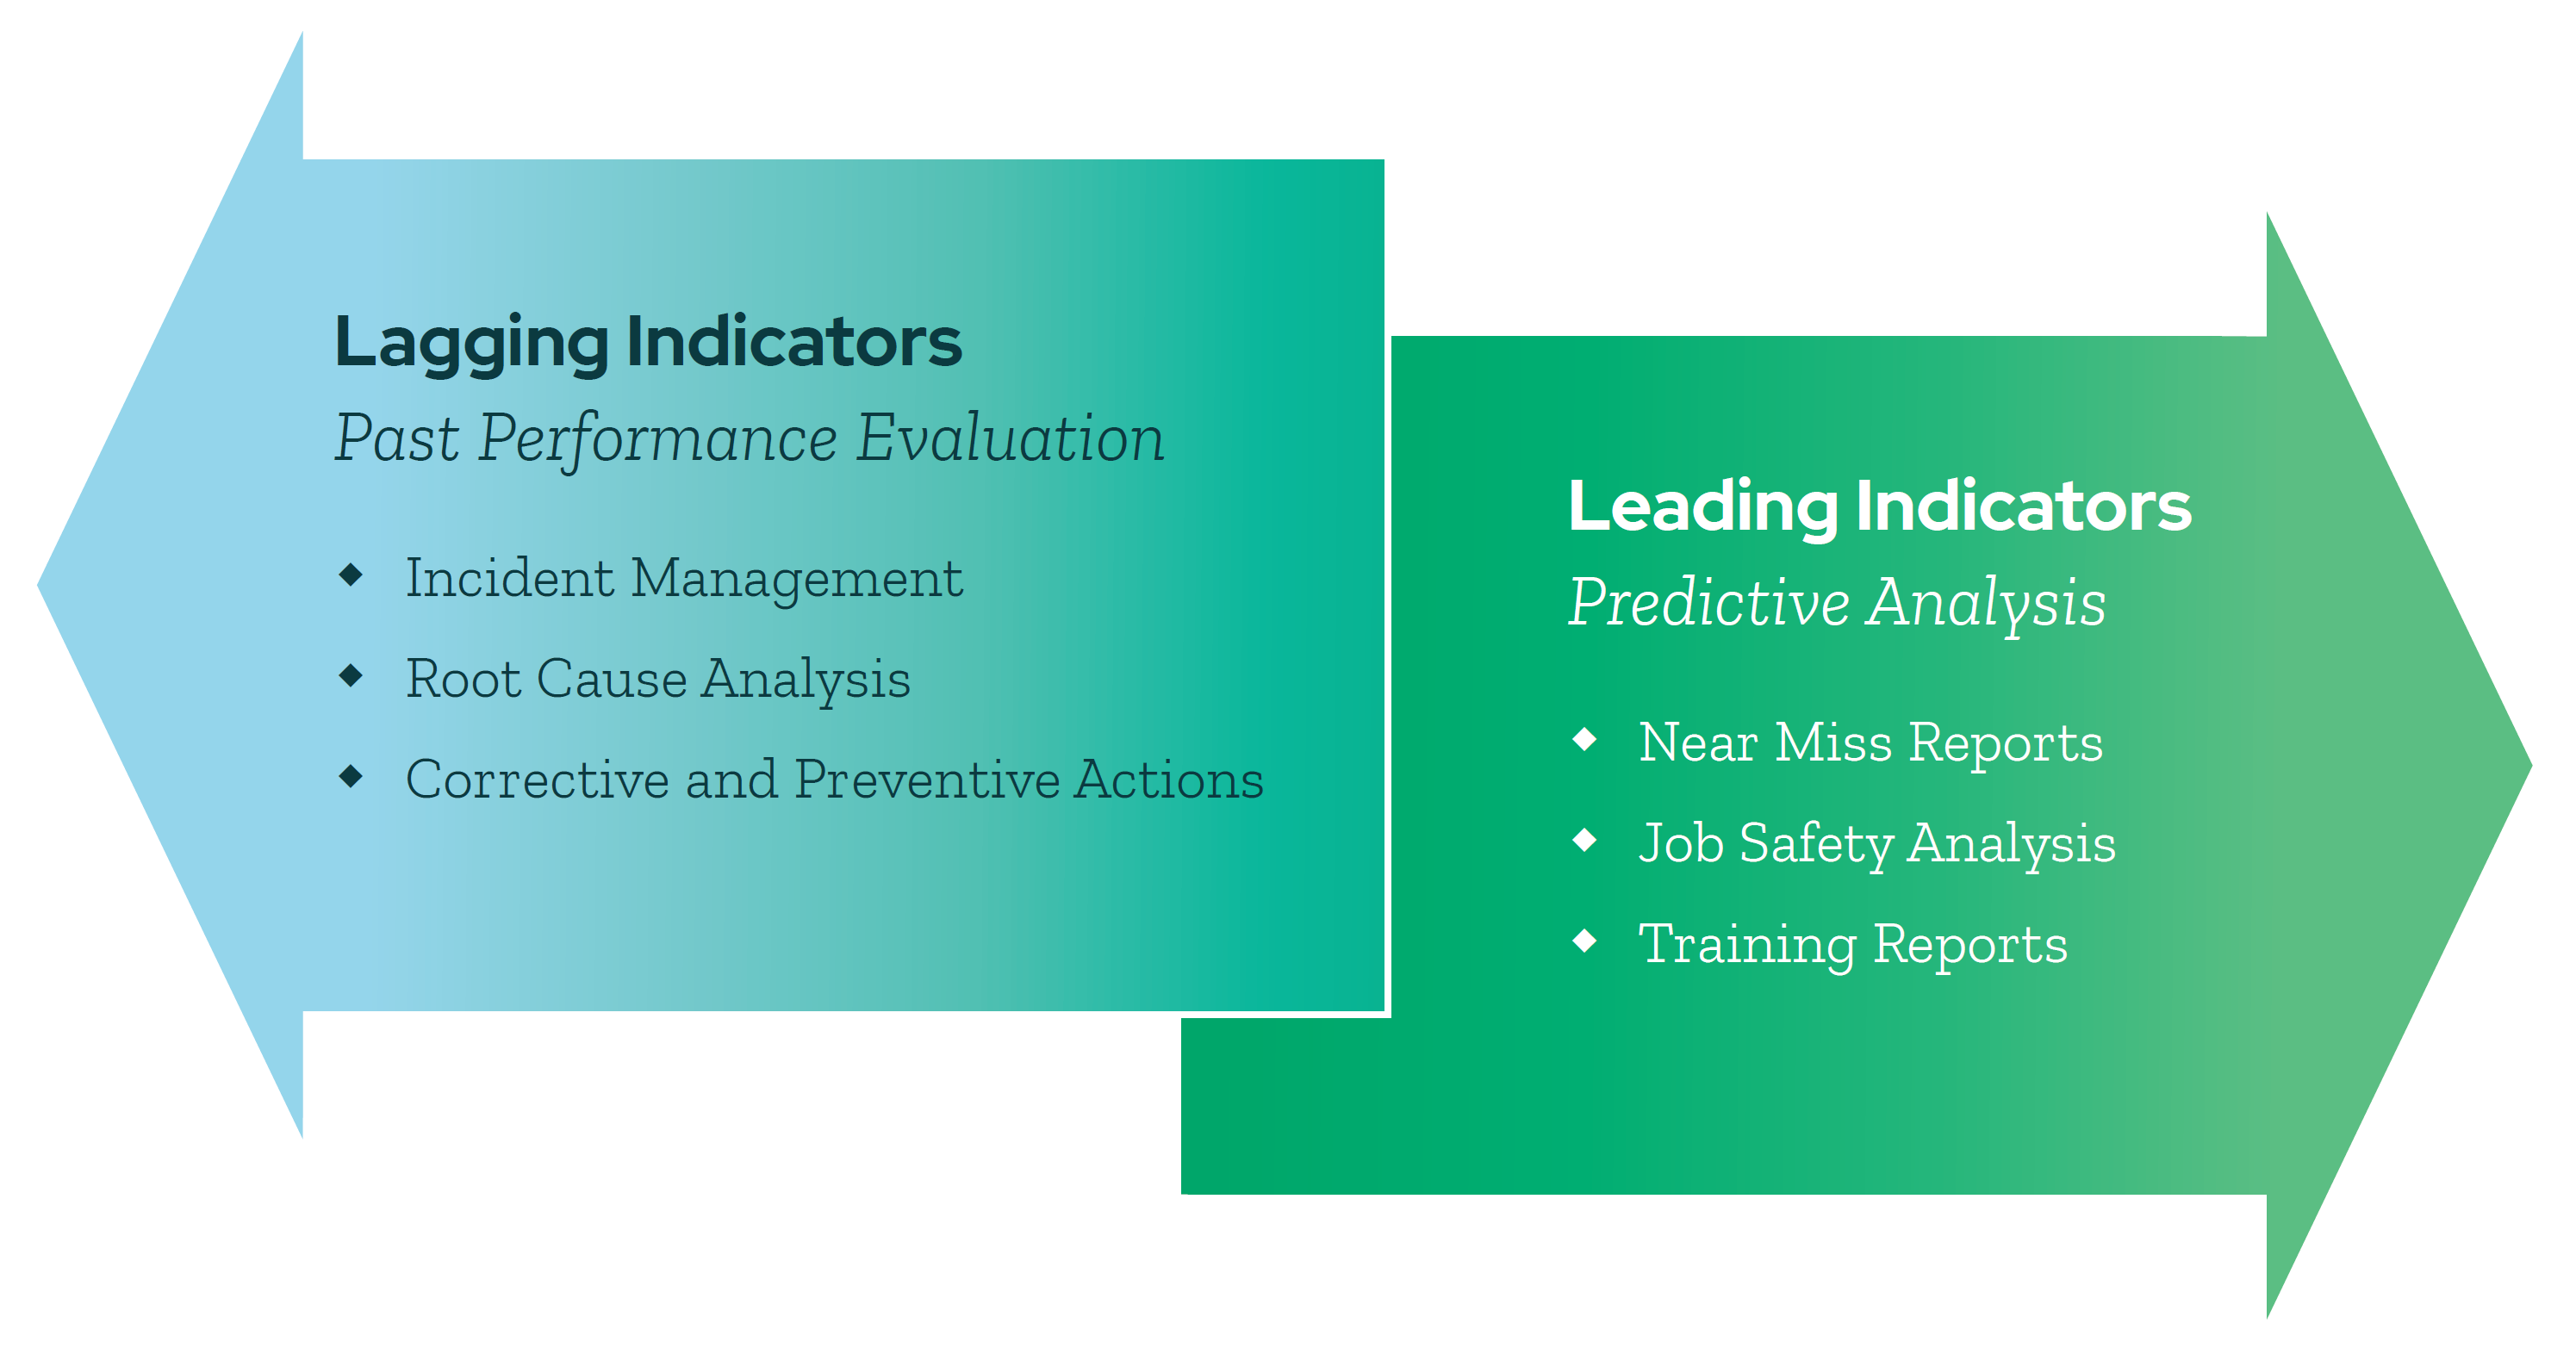
As we discussed in a previous post, most safety data can be put into one of two categories: leading indicators and lagging indicators. Leading indicators use predictive measurements, like Near Miss Reports and Job Safety Analysis, to prevent future accidents and injuries. Lagging indicators use data points like Incidents Management and Root Cause Analysis to take a look at past performance and identify what needs improvement. Armed with a holistic view of past performance and future incidents, safety leaders can make informed decisions on how to best improve their workplace safety procedures.

Examples of Safety Leading Indicators
Leading Indicators are the forward-thinking reporting measurements used to predict and prevent future incidents. Here are some examples you may find in your day-to-day.
Near Miss Reporting
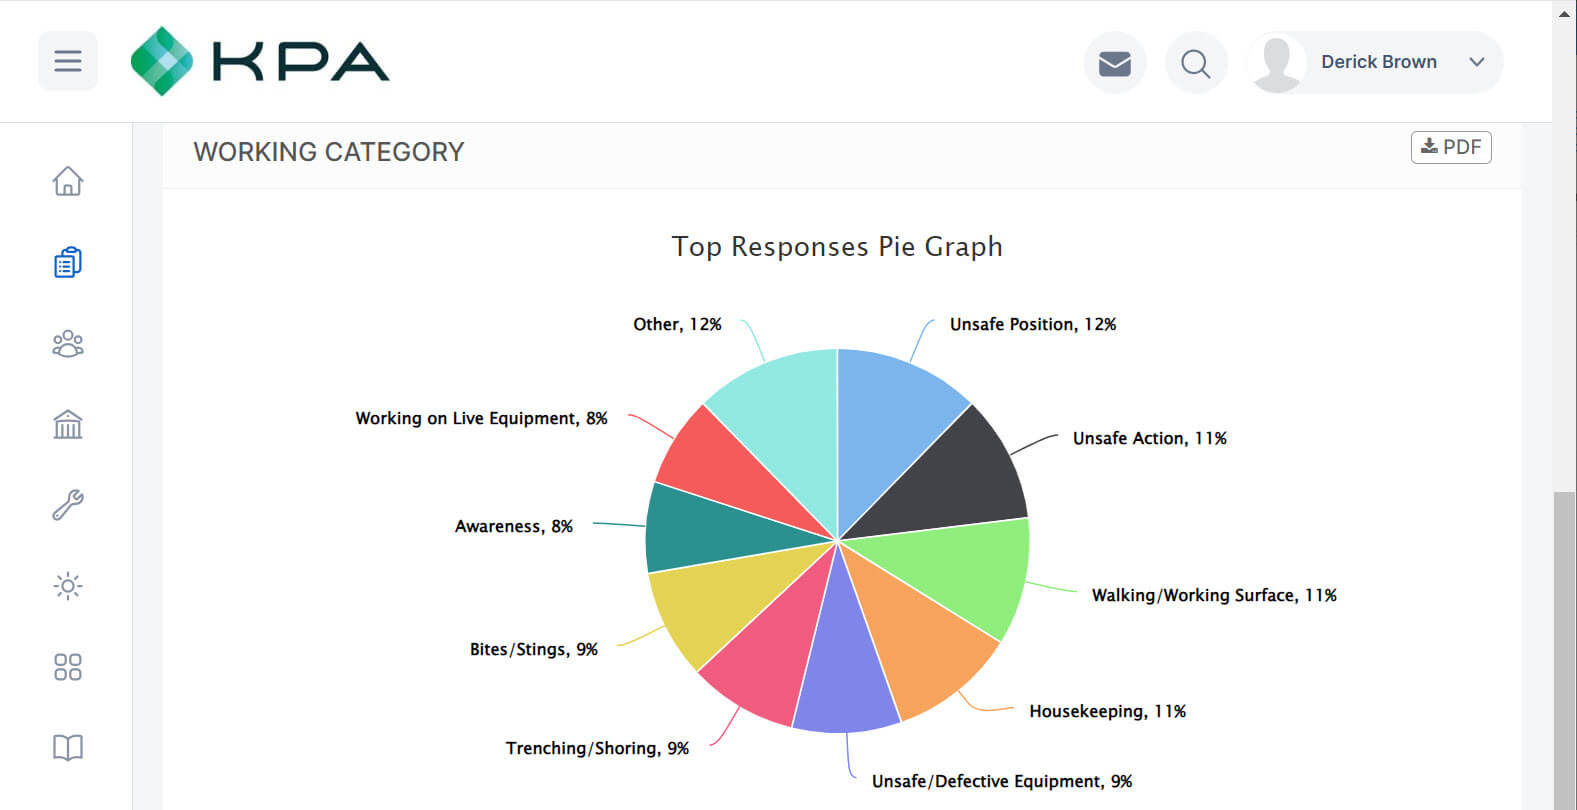
Start with Near Miss Reports. They are leading indicators used to reduce potential incidents by keeping a careful record of all close calls reported to management. By tracking near misses, safety leaders can proactively prevent them from recurring, potentially resulting in more severe injuries. Organizations with a Near Miss policy and a system to capture and report them are taking the proper steps to identify and control hazards, reduce risk and prevent harmful incidents.

Job Safety Analysis
Another way to capture leading indicators is a Job Safety Analysis (or JSA for short). JSA is a reporting tool used to identify and control potential hazards associated with jobs, procedures, environments, or processes. JSA’s are an exercise in detective work to help answer questions like “What could go wrong?” and “What are the consequences?” By tracking via JSA, you can stay aware of safety concerns, inform your policies, and eliminate hazards that lead to serious accidents.

Training Reports
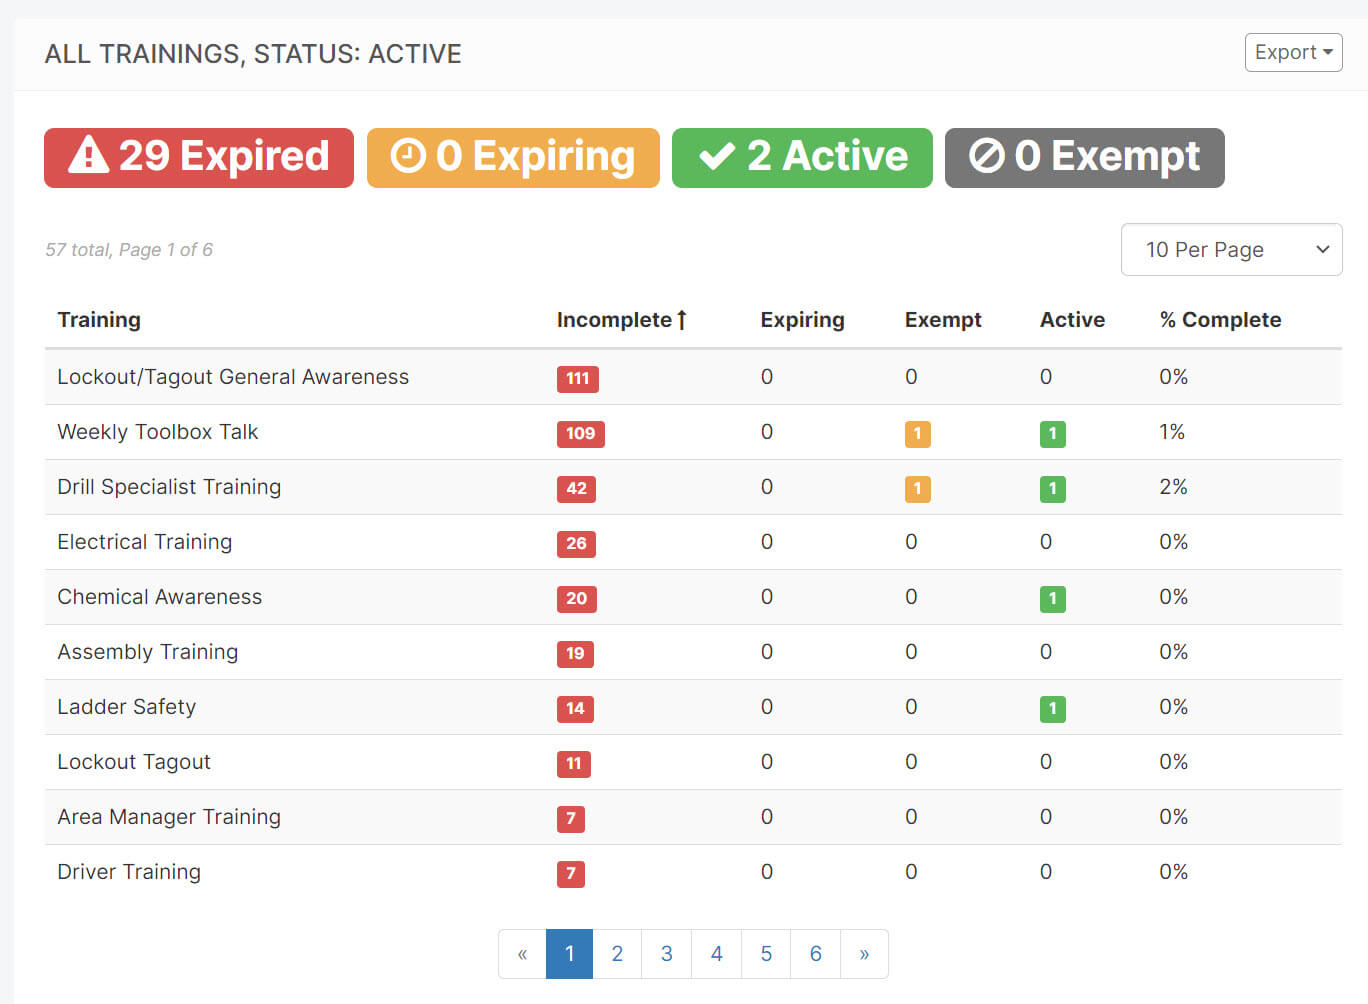
Training Reports are an equally crucial leading indicator. Proper training can prevent many serious workplace injuries. And pockets of employees who haven’t completed their safety training are red flags for mishaps in the future. Gain a holistic view of your companies’ training completion rates using training reports, then follow up with the laggards who may be putting themselves at risk by not completing required training.


Download this eBook to learn the different types of safety data and best practices for using data and analytics to improve your safety program.
Looking at Leading Indicator Data: Training Data
Training reports give insight into how well your safety training programs are being implemented in your company. Using valuable data insights, you can determine the levels of training course completion and where areas of retraining are needed. Here are three important pieces of training data you can use to help improve your safety program.
Training Completions
The percentage of training courses completed by your employees can be used as a positive leading indicator by which you can evaluate the implementation levels of your training program.
Training Incompletions
The percentage of incomplete training courses can be used to evaluate possible risks within your company. Incomplete training courses indicate knowledge gaps in your workforce that could lead to future accidents.
Retraining
Using data on repeated accidents, near accidents, and incomplete training courses, you can make informed decisions on what retraining is needed to keep your workforce safe and prevent incidents.
The reports you need to make data-driven decisions about your safety programs will adequately equip you to maintain a safe and healthy workforce.
KPA EHS Helps Businesses Take a Data-Driven Approach to Safety
KPA EHS simplifies data visualization and reporting, giving users easy access to actionable insights into their EHS program performance. Your data is presented in real-time, so no delay or extra steps are required to access the information. The dashboards are configured based on features tailored to your business’s unique requirements, giving you the power to make informed decisions that impact workplace safety.
Let KPA show you how to take a data-driven approach to safety.
Related Content
Explore more comprehensive articles, specialized guides, and insightful interviews selected, offering fresh insights, data-driven analysis, and expert perspectives.
