Companies that leverage their safety data and analytics to maintain a safe workplace are setting themselves up for success.
Safety leaders armed with data visuals and interpretations can make educated decisions that drive productivity, foster a strong culture of safety in the workplace, and encourage continuous improvement.
Drive Productivity
Injuries and illnesses can slow down your workforce and grind productivity to a halt. Depending on the severity, a workplace injury can result in direct and indirect productivity impacts, including:
- Time lost to work stoppage
- Damage to tools and equipment
- Administrative time spent by supervisors and safety managers
- Replacement worker training costs
Using data-driven safety strategies can help you avoid workplace accidents that hinder your team’s productivity.
Build Safety Culture
By presenting data to your employees and opening a discussion on interpretations, you can instill a stronger safety culture through team member engagement and transparent leadership. Together, you and your team can make data-driven decisions on improving workplace safety measures.
Continuous Improvement
Effective safety leaders constantly evaluate their safety procedures and make adjustments accordingly. You can harness the power of data and analytics to identify opportunities for continuous improvement to your safety procedures.
Types of Safety Data, and How to Use Them
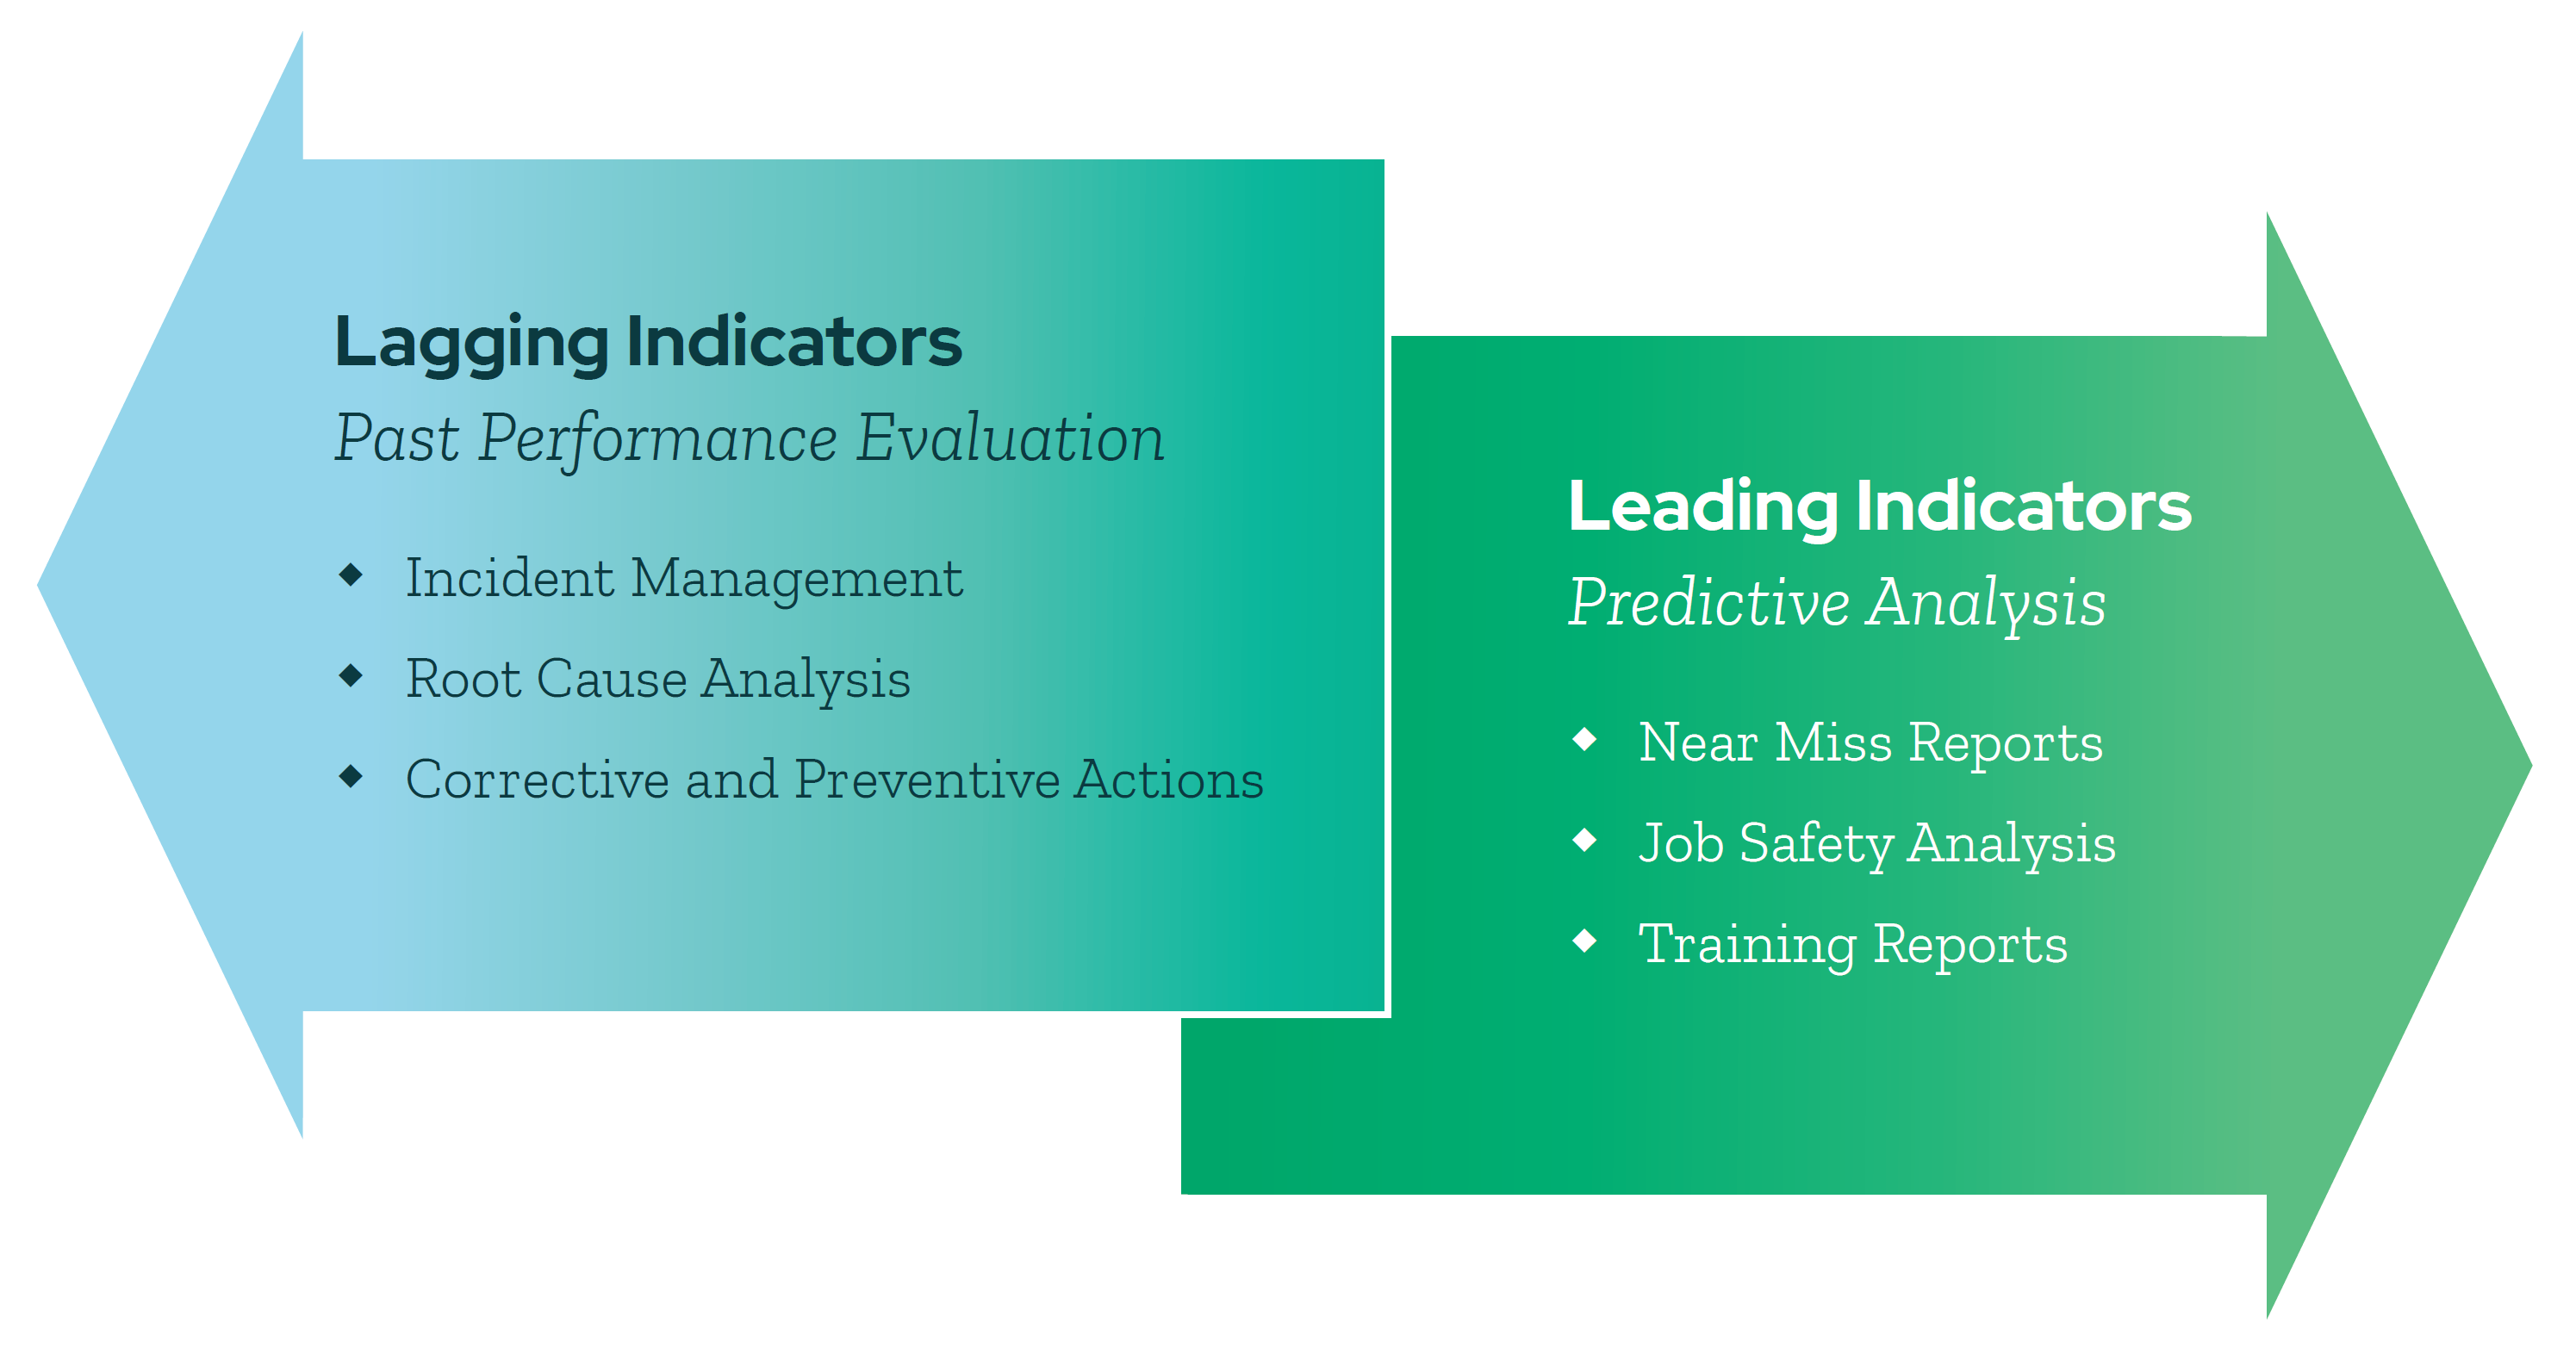
Most safety data can be put into one of two categories: leading indicators and lagging indicators. Leading indicators use predictive measurements, like Near Miss Reports and Job Safety Analysis, to prevent future accidents and injuries. Lagging indicators use data points like Incidents Management and Root Cause Analysis to take a look at past performance and identify what needs improvement. Armed with a holistic view of past performance and future incidents, safety leaders can make informed decisions on how to best improve their workplace safety procedures.
Leading and Lagging Indicators

Leading Indicators are the forward-thinking reporting measurements used to predict and prevent future incidents.
Lagging Indicators are the retrospective reporting measurements that help evaluate past performance and inform future policies.
KPA EHS Helps Businesses Take a Data-Driven Approach to Safety
KPA EHS simplifies data visualization and reporting, giving users easy access to actionable insights into their EHS program performance. Your data is presented in real-time, so no delay or extra steps are required to access the information. The dashboards are configured based on features tailored to your business’s unique requirements, giving you the power to make informed decisions that impact workplace safety.
Visualize EHS Program Data
With KPA EHS data and analytics, you can view metrics, top issues, and compliance percentages in a single view. Our data visualization allows you to capture metrics based on existing client application configurations (no out-of-the-box static reports) and drill down into detailed reports to see more granular underlying data. You can filter your KPA EHS data to quickly identify trends and risk indicators by location or group from training reports.
Generate Flexible Reports
KPA EHS allows you to export reporting data for use in spreadsheet applications or other reporting programs and quickly develop executive-level summaries and reports. Easily share reporting data to encourage all employees to stay committed to safety.
Improve Overall Safety Performance
Use the insights provided by KPA EHS reporting to implement ongoing safety program improvements with data-driven decision-making and a view into leading indicators where potential problems could arise. Our reporting features give you greater confidence that your EHS data is current and accurate.
Let KPA show you how to take a data-driven approach to safety.
